Erste digitale Schritte
Qucs ist auch eine grafische Benutzeroberfläche für die Durchführung von digitalen Simulationen. Dieses Dokument enthält einen kurze Beschreibung, wie dies vonstatten geht.
For digital simulations Qucs uses the FreeHDL program (http://www.freehdl.seul.org). So the FreeHDL package as well as the GNU C++ compiler must be installed on the computer.
There is no big difference in running an analog or a digital simulation. So having read the Getting Started for analog simulations, it is now easy to get a digital simulation work. Let us compute the truth table of a simple logical AND cell. Select the digital components in the combobox of the components tab on the left-hand side and build the circuit shown in figure 1. The digital simulation block can be found among the other simulation blocks.
Die Digitalquellen S1 und S2 sind die Eingänge, der Knoten mit der Bezeichnung Ausgang ist der Augang. Nach dem Starten der Simulation öffnet sich die Seite für die Datenvisualisierung. Das Diagramm Logiktabelle wird darauf platziert und die Variable Ausgang anschließend eingefügt. Jetzt wird die Logiktabelle eines UNDs mit zwei Eingängen angezeigt. Gratulation, die erste Digitalsimulation ist fertig!
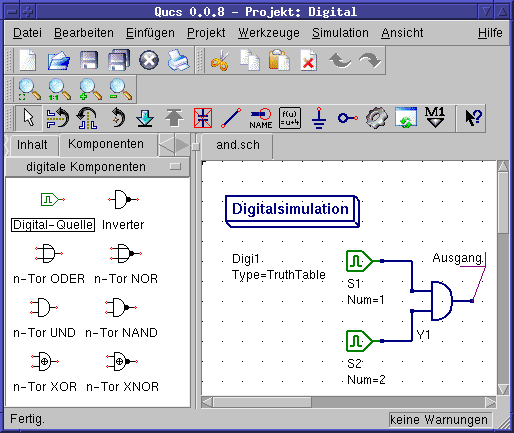
Abbildung 1 - Qucs Hauptfenster
Die Logiktabelle ist nicht die einzige Digitalsimulation, die Qucs durchführen kann. Es ist weiterhin möglich, ein beliebiges Signal in einen Schaltkreis einzuspeisen. Die Ausgangssignale können dann mit Hilfe eines Zeitdiagramms angezeigt werden. Um das zu erreichen, muss der Parameter Type des Simulations-Blocks auf TimeList gesetzt werden und die Zeitdauer der Simulation in den darauf folgenden Parameter eingetragen werden. Die Digitalquellen haben jetzt eine andere Bedeutung: Sie geben eine beliebige Bitsequenz aus, indem ein Ausgangszustand, das erste Bit, (low oder high) und eine Liste von Zeiten, an denen der Zustand gewechselt werden soll, definiert wird. Es ist zu beachten, dass diese Liste nach derem Ende wiederholt wird. Um ein 1GHz Taktsignal mit einem Tastverhältnis von 1:1 zu erzeugen, sieht die erwähnte Liste so aus: 0.5ns; 0.5ns
Um sich die Ergebnisse dieser Simulationsart anzusehen, gibt es den Diagrammtyp Zeitverlaufsdiagramm. Darin können die Ergebnisse aller Knoten Zeile für Zeile angezeigt werden. Viel Spaß dabei...
VHDL File Component
More complex and more universal simulations can be performed using the component “VHDL file”. This component can be picked up from the component list view (section “digital components”). Nevertheless the recommended usage is the following: The VHDL file should be a member of the project. Then go to the content list view and click on the file name. After entering the schematic area, the VHDL component can be placed.
The last entity block in the VHDL file defines the interface, that is, all input and output ports must be declared here. These ports are also shown by the schematic symbol and can be connected to the rest of the circuit. During simulation the source code of the VHDL file is placed into the top-level VHDL file. This must be considered as it causes some limitations. For example, the entity names within the VHDL file must differ from names already given to subcircuits. (After a simulation, the complete source code can be seen by pressing F6. Use it to get a feeling for this procedure.)